XM Stock Index CFDs
XM Stock Index CFDs
XM offers a total of 31 types of stock index CFDs, including 20 spot products and 11 futures products . You can trade major stock indexes listed on stock exchanges around the world, such as the S&P 500 (US500), Dow Jones Industrial Average (US30), and Nikkei Stock Average (JP225), using CFDs (contracts for difference). XM’s stock index CFDs offer leverage of up to 50x to 500x depending on the stock , allowing you to enjoy dynamic trading with a small amount of capital while reducing the required margin.
XM also boasts an industry-leading average execution rate of 99.35% and offers generous bonus campaigns. Bonuses earned through bonus campaigns can be used as trading capital of the same amount, making it possible to start stock index CFD trading with less initial capital. For a limited time, if you open a new XM account through this website, we will give you an account opening bonus of 15,000 yen (normally 3,000 yen). Please take advantage of this opportunity.
XM Stock Index CFDs
XMTrading allows you to trade 20 spot stocks and 11 futures stocks of stock indexes listed on stock exchanges around the world using CFDs (contracts for difference).Since the composition and trading conditions of stock indexes vary depending on the stock, by understanding the characteristics of each stock, you can trade stock index CFDs under more advantageous conditions.
What is a stock index?
A stock price index is an index that quantifies the stock prices of multiple stocks using a certain formula to show the movement of the entire stock market . It is difficult to grasp the movement of the stock market as a whole by just looking at the movements of individual stocks, but by checking the stock price index, it is possible to understand the movement of the entire market.
For example, in the case of the Nikkei Stock Average (JP225), the constituent stocks are selected by the Nikkei Inc. from stocks listed on the Prime Market of the Tokyo Stock Exchange, taking into consideration market liquidity and the balance between industries. Similarly, other stock indexes are composed of representative stocks on major exchanges in each country, so stock indexes are closely watched by investors and traders as indicators of each country’s economic trends.
XM stock index CFD trading
XM trading offers spot and futures stock index contracts as CFDs. CFDs are contract-for- difference transactions where no actual physical delivery of the product takes place, and only the difference between the opening and closing positions is settled . CFDs are a way of trading financial products such as stocks and commodities through a broker, and their main features are the ability to start trading from a short position and the possibility of leveraged trading. XM’s stock index CFDs allow you to trade in a comfortable environment with high leverage and a zero-cut system.
XM’s stock index CFDs are available for spot and futures
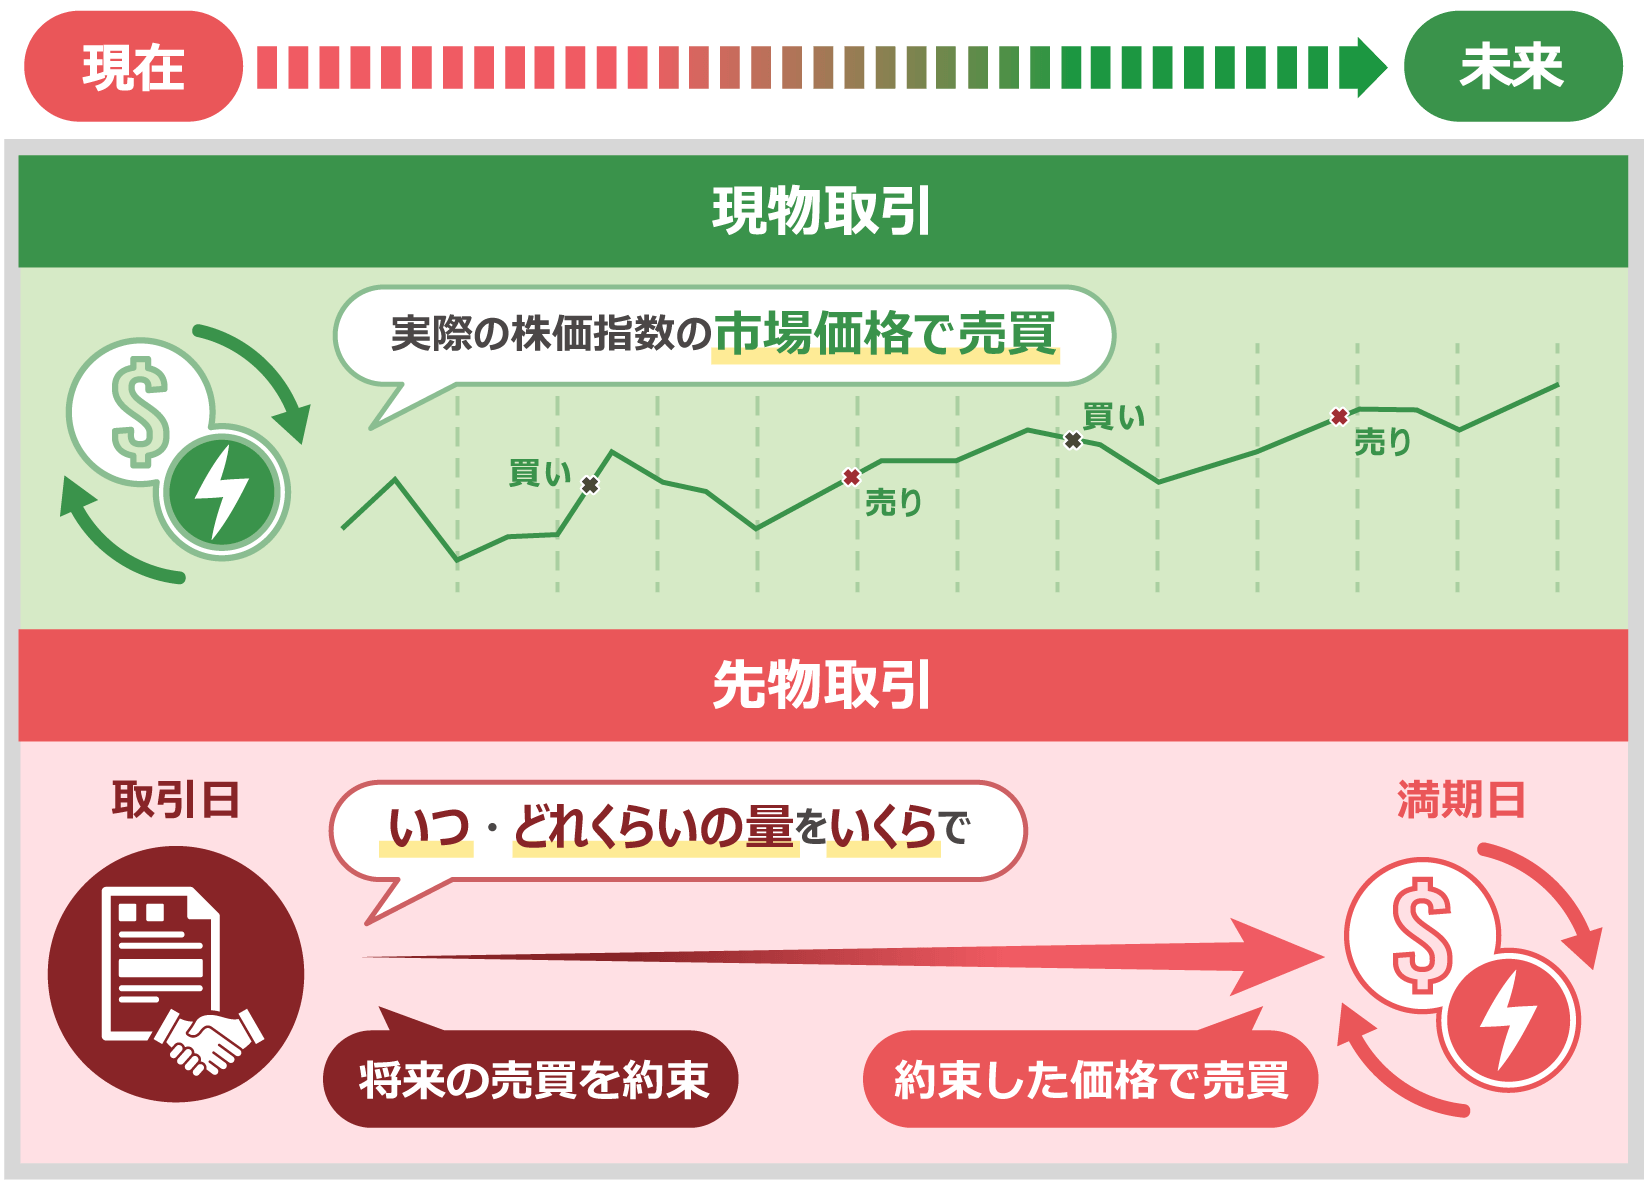
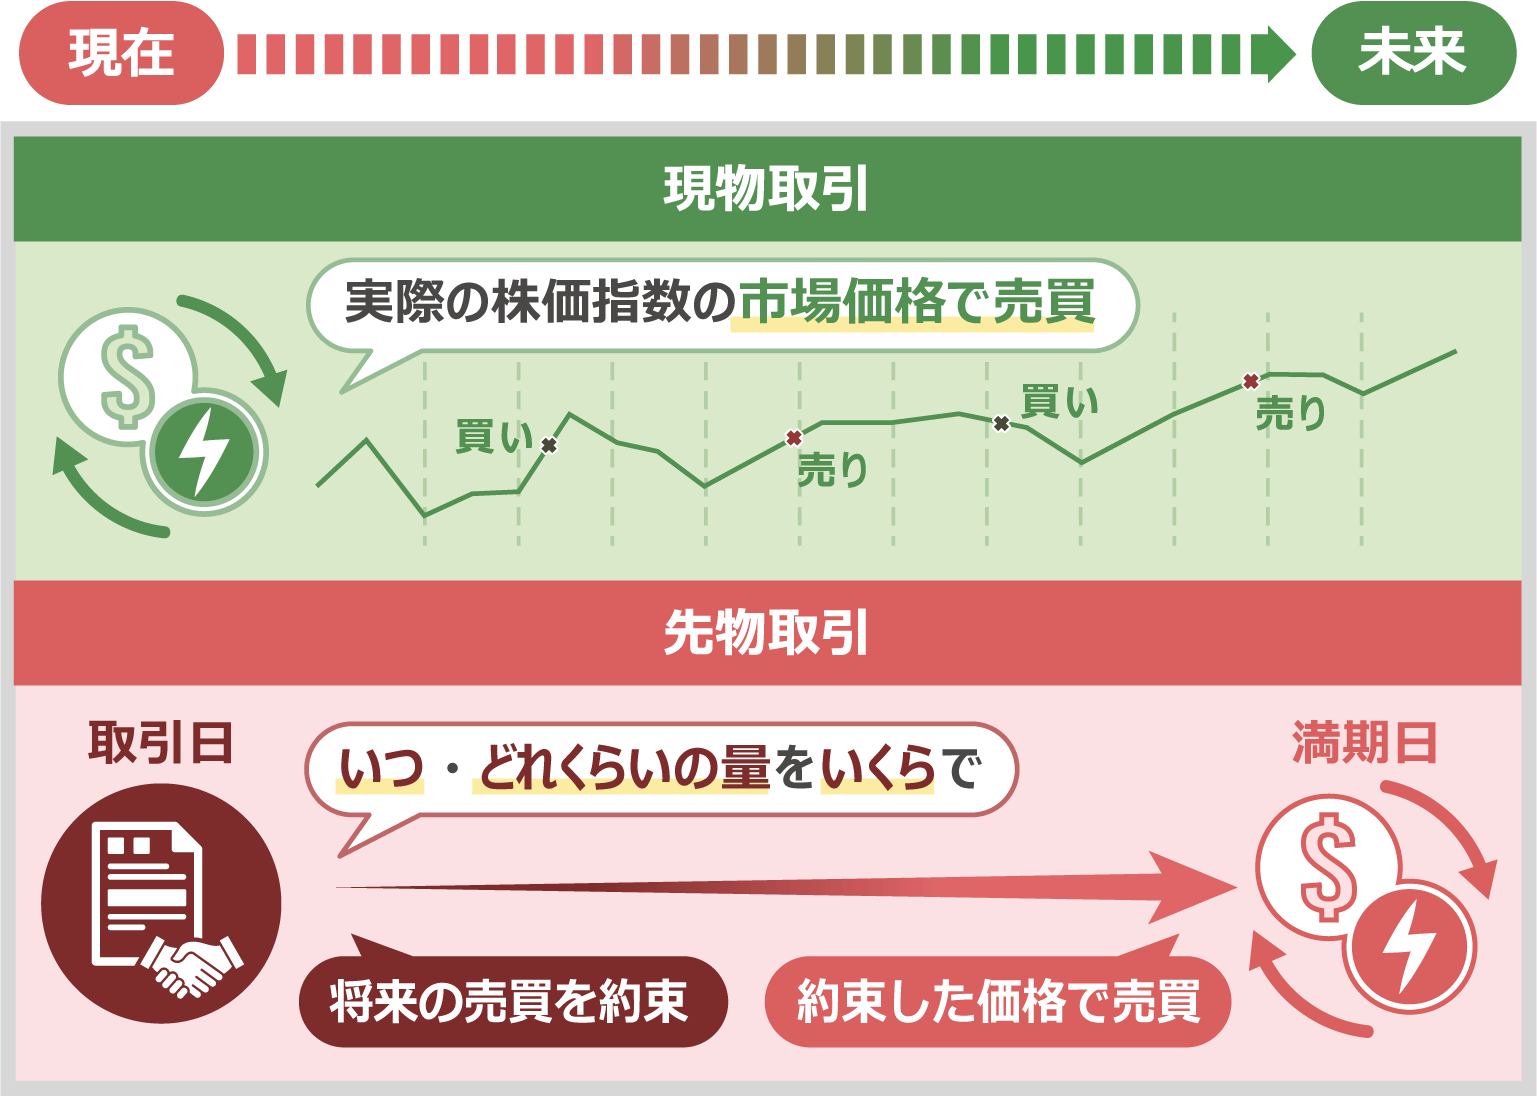
XM offers spot and futures CFD trading for stock indices. Spot trading of stock index CFDs involves buying and selling based on the actual price fluctuations of the stock index . XM’s spot trading of stock index CFDs incurs swap points, so when you hold a position, the profit or loss due to swap points is added at the rollover time from Monday to Friday. In addition, spot trading is subject to dividend adjustments, so profit or loss due to dividend adjustments is added depending on the position you hold.
On the other hand, stock index CFD futures trading is a transaction that promises to buy and sell at a set price on a predetermined date in the future . XM’s stock index CFD futures trading does not apply swap points, so you can trade at low costs even with stocks that incur negative swaps. Another feature of stock index CFD futures trading is that it has a set expiration date (settlement date). Please be careful when managing your schedule, as open positions will be forcibly settled when the expiration date arrives.
Difference between XM Stock Index CFD Spot and Futures
| Terms and Conditions | Actual item | futures |
| Contract month (settlement date) | none | Yes (1-3 months) |
| Spread | narrow | wide |
| Swap Points | can be | none |
| Dividends | can be | none |
For more information on XM’s Nikkei 225 (JP225) trading, click here
XM stock index CFDs have expiration dates
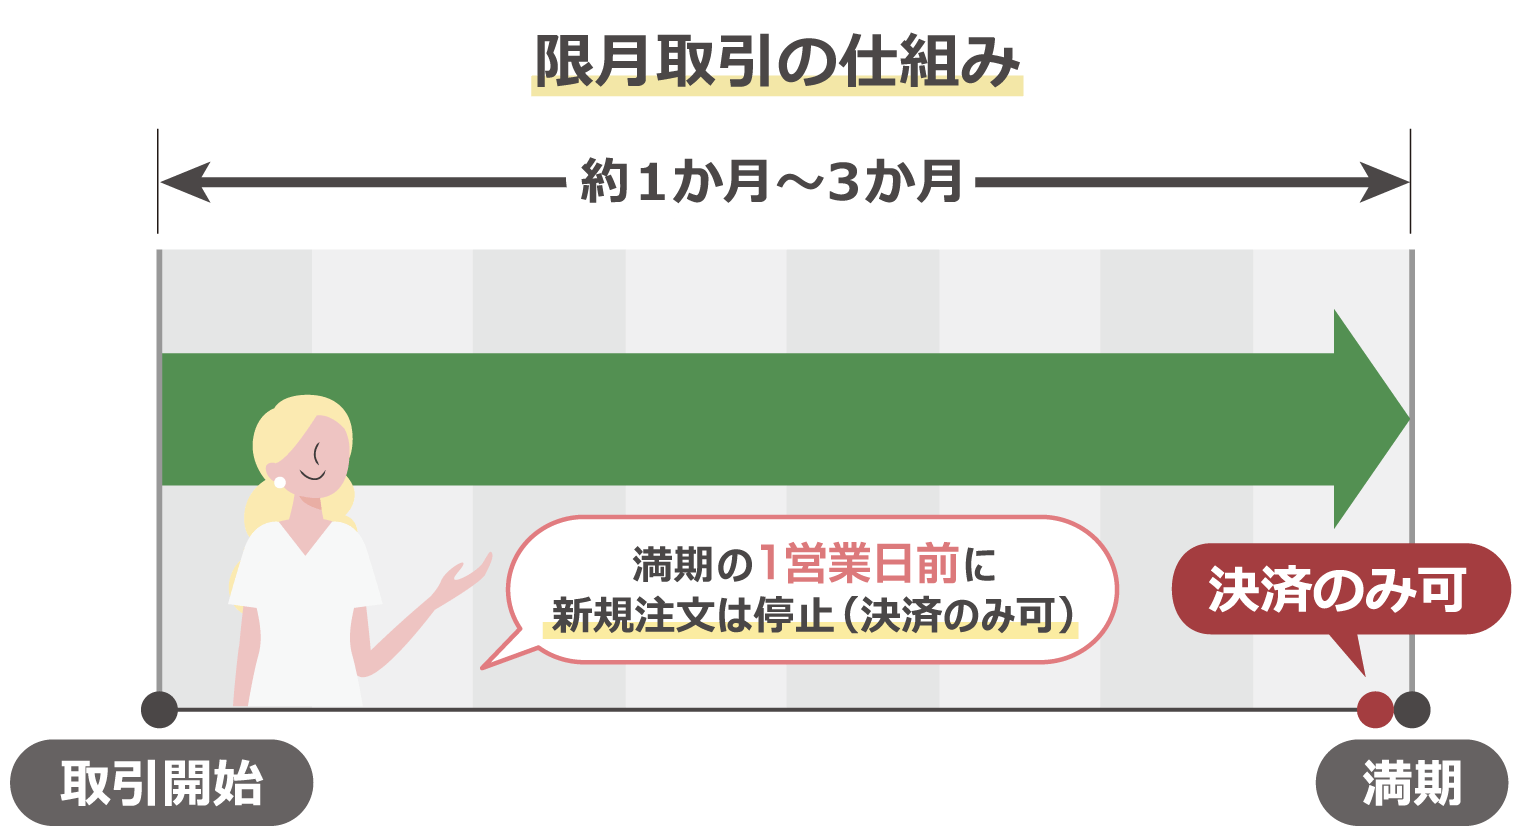
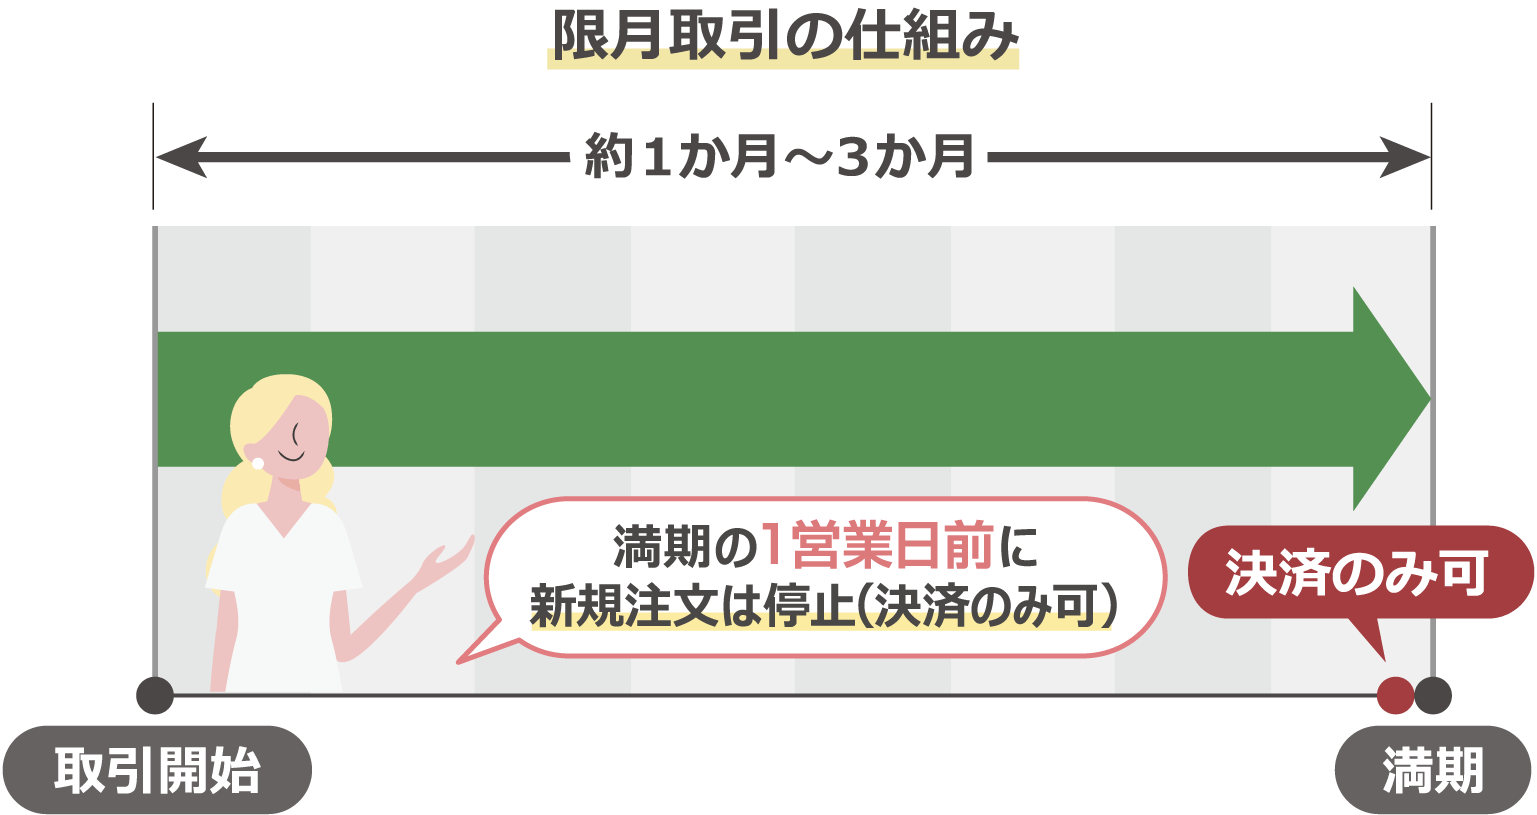
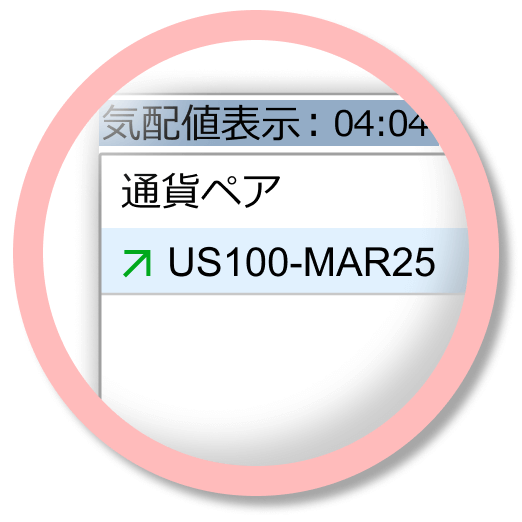
XM’s stock index CFDs have an expiration date (settlement date) for futures trading. The expiration date refers to the date on which the contract expires for a futures trading product, and futures positions that reach the settlement date are automatically settled . XM makes it easy to determine the expiration date and settlement date from the symbol name. For example, in the case of “JP225-MAR25,” “MAR” = March and “25” = 2025, indicating that the expiration date is March 2025. When trading XM’s stock index CFD futures, please be sure to manage your schedule carefully.
XM stock index CFDs allow you to receive dividends
With XM stock index CFDs, you can receive an amount equivalent to the actual dividend as a dividend adjustment . Because stock index CFDs do not directly hold physical products, you cannot receive the dividends paid by companies to shareholders as is. Instead, an amount equivalent to the dividend is reflected in your trading account as a dividend adjustment. Note that the profit and loss for dividend adjustments differ depending on whether you are holding a long or short position, and the amount is determined by trading volume. When trading stock index CFDs with XM, please be sure to pay attention to position management and check each company’s dividend schedule.
Click here for details on dividend adjustments for XM Stock Index CFDs
XMTrading’s stock index CFDs offer a total of 31 products, including 20 spot products and 11 futures products based on a wide range of stock indexes listed on stock exchanges around the world . Since the characteristics and trends vary depending on the product, understanding the characteristics and trends of each product in advance will allow you to start trading more advantageously. The representative stock index CFDs offered by XM are as follows:
Nikkei Stock Average (JP225)
The Nikkei Stock Average (JP225) is a stock price index of the Tokyo Stock Exchange in Japan. It is an index calculated by Nikkei Inc., which selects 225 stocks from those listed on the Tokyo Stock Exchange Prime market and averages the stock prices. The 225 stocks that make up the Nikkei Stock Average (JP225) are selected with consideration given to the balance between sectors (industries) and are those with high market liquidity. As the major stocks in each industry are selected, it is a stock that attracts attention as an important indicator that reflects the state of the Japanese economy.
What is the stock price average type?
Stock price averages are a method of calculating average stock prices by adding up the stock prices of the constituent stocks of a stock index and dividing by a divisor (a number used to calculate a stock index). It is calculated by “total stock prices of constituent stocks divided by divisor” and is expressed in the country’s currency, such as yen or dollars. The higher the stock price (high-priced stock), the greater the impact it has on the price movements of the index, and its advantage is that it makes it easy to grasp the price movements of the entire stock market. Typical stock price average indices include the Nikkei Stock Average (JP225) and the Dow Jones Industrial Average (US30).
For more information on XM’s Nikkei 225 (JP225) trading, click here
S&P 500 (US 500)
The S&P 500 (US 500) is one of the leading US stock price indices published by S&P Dow Jones Indices. It is a market capitalization-weighted index of 500 representative stocks listed on the New York Stock Exchange (NYSE) and NASDAQ. The S&P 500 accounts for approximately 80% of the market capitalization of the entire US stock market. For this reason, it is attracting attention as an important stock for understanding the US economic situation and market trends, as well as for understanding the movements of the US stock market as a whole.
What is market capitalization weighted?
Market capitalization-weighted indexes are a method of showing changes in market capitalization since a certain point in time by adding up the market capitalizations of the constituent stocks of a stock index and dividing by the total market capitalization at a certain point in time. The calculation is expressed in points. Market capitalization- weighted indexes are more susceptible to price movements of large-cap stocks, making them more accurate in understanding the overall stock market. Furthermore, when used as a benchmark for performance evaluation in asset management, the increase or decrease in market capitalization directly indicates the fund’s asset value, providing a more accurate view of performance than stock price averages. Typical market capitalization-weighted indexes include the S&P 500 (US 500), Nasdaq Stock Average (US 100), and Euro Stoxx (EU 50), among many others.
Dow Jones Industrial Average (US30)
The Dow Jones Industrial Average (US 30) is a stock index calculated by the US company Dow Jones Indices, which selects constituent stocks from US listed companies. The US 30 is calculated as a stock price average and consists of a total of 30 stocks from major US companies, including Apple and Boeing. Like the US 500, it is a stock index with a long history, so it can be used to understand the US economic situation and trend market, as well as to examine past data as a source of information for the US stock market.
Nasdaq Stock Average (US100)
The Nasdaq Stock Average (US 100) is a market capitalization-weighted stock index composed of stocks listed on the American electronic stock market, NASDAQ. The Nasdaq Stock Average is characterized by the fact that it is calculated based on all 3,000+ stocks listed on NASDAQ, not just stocks that meet certain conditions. Since many of the stocks listed on NASDAQ are high-tech and IT-related stocks such as Microsoft and Alphabet, it is also attracting attention as an indicator of trends in the industry.
Euro Stoxx (EU50)
Euro STOXX (EU50) is a stock price index calculated and published by STOXX, a joint venture between Deutsche Börse and SIX Swiss Exchange. It is composed of 50 stocks representing the 12 major countries in the eurozone and is calculated as a market capitalization-weighted average. France, Germany, Spain, and Italy account for 80% of the index, and it is a stock that attracts attention as an important indicator of stock price trends and economic conditions in the eurozone.
Hong Kong Hang Seng Index (HK50)
The Hang Seng Index (HK50) is a stock price index of the Hong Kong Stock Exchange. It is a market capitalization-weighted index of the 50 major stocks on the Hong Kong Stock Exchange and is known as one of the leading indices for the Asian market. Because Hong Kong is an important financial hub in the Asian region, the movements of the Hang Seng Index can affect the entire Asian market. For this reason, it is a stock that is closely watched as an important indicator for understanding the economic situation and trends not only in Hong Kong but also in the Asian market.
XMTrading’s stock index CFDs differ from FX currency pair trading in that the conditions for leverage, trading hours, etc. vary for each product. Please check the trading conditions for each product before starting trading.
XM Stock Index CFD Trading Account Types
XMTrading’s stock index CFDs can be traded with all account types. The four account types – Standard Account , Micro Account , KIWAMI Account , and Zero Account – all have the same trading conditions, so you can choose the account type that best suits your trading strategy. Choose the account type that best suits your trading strategy and experience XM’s comfortable trading environment.
XM Index CFD Trading Hours
XMTrading’s stock index CFD trading hours vary depending on the stock exchange. There are differences depending on the stock and summer/winter time, so please check the trading hours of the stock you wish to trade in advance. XM’s stock index CFD trading hours are as follows.
XM Stock Index CFD Trading Hours (Japan Time)
| Brand | Daylight Saving Time | Winter time | ||
| AUS200Cash (ASX 200) |
[Monday to Thursday] | 6:55-13:25 14:15-4:55 the next day |
[Monday to Thursday] | 7:55-14:25 15:15-5:55 the next day |
| 【Friday】 | 6:55-13:25 14:15-4:45 the next day |
【Friday】 | 7:55-14:25 15:15-5:45 the next day |
|
| CA60Cash (Canada 60 Index Cash) |
[Monday to Friday] | 15:05-22:10 22:35-5:15 the next day |
[Monday to Friday] | 16:05-23:10 23:35-6:15 the next day |
| ChinaHCash (Hong Kong China H-shares Index Cash) |
[Monday to Friday] | 9:20-11:55 13:05-16:25 |
[Monday to Friday] | 10:20-12:55 14:05-17:25 |
| AUS200Cash | ||
| 夏時間 | 月~木 | 6:55~13:25 14:15~翌 4:55 |
| 金 | 6:55~13:25 14:15~翌 4:45 |
|
| 冬時間 | 月~木 | 7:55~14:25 15:15~翌 5:55 |
| 金 | 7:55~14:25 15:15~翌 5:45 |
|
-
Trading hours are the same for spot and futures.
-
Please be aware of changes in trading hours due to holidays such as New Year’s and Christmas when the market is closed, and due to the change between summer and winter time.
XM Stock Index CFD Supported Trading Platforms
XMTrading allows you to trade stock index CFDs on two trading platforms: MT4 (MetaTrader 4) and MT5 (MetaTrader 5). Some stock index CFDs are only compatible with MT5, so please check the compatible trading platform before trading. The trading platforms compatible with XM stock index CFDs are as follows:
XM Stock Index CFD (spot) trading platform
| Brand | MetaTrader 4 (MT4)MT4 | MetaTrader 5 (MT5)MT5 |
| AUS200Cash (ASX 200) |
||
| CA60Cash (Canada 60 Index Cash) |
– | |
| ChinaHCash (Hong Kong China H-shares Index Cash) |
– |
XM Stock Index CFD (Futures) compatible trading platform
| Brand | MetaTrader 4 (MT4)MT4 | MetaTrader 5 (MT5)MT5 |
| EU50 (EURO STOXX 50) |
||
| FRA40 (CAC 40) |
||
| GER40 (DAX) |
XM Stock Index CFD Leverage
XM stock index CFDs can be traded with a maximum leverage of 50x to 500x for each stock. Leverage is not limited by the trading account balance (account funds), and you can trade at a fixed margin rate for each stock . Leverage for XM stock index CFDs varies by stock, so please check the leverage for each stock before trading. The leverage for XM stock index CFDs is as follows:
XM Stock Index CFD (Spot) Leverage
| Brand | Leverage |
| AUS200Cash (ASX 200) |
100 times |
| CA60Cash (Canada 60 Index Cash) |
250 times |
| ChinaHCash (Hong Kong China H-shares Index Cash) |
250 times |
XM Stock Index CFD (Futures) Leverage
| Brand | Leverage (fixed) |
| EU50 (EURO STOXX 50) |
100 times |
| FRA40 (CAC 40) |
100 times |
| GER40 (DAX) |
500 times |
-
Leverage will be applied depending on which is lower: the maximum leverage for each product or the leverage set in your account. Please note that if the leverage set in your account is lower than the maximum leverage for the stock index CFD product you are trading, the leverage set in your account will be applied.
XM Stock Index CFD Margin Requirements
The margin required when trading XMTrading stock index CFDs varies depending on the price of the trading instrument, contract size, and number of trading lots. The margin required for XM stock index CFDs can be calculated using the following formula.
XM Index CFD Margin Calculation
Number of Lots x Contract Size x
Opening Price (*) ÷ Leverage
= Required Margin
Prices are always changing.
For example, when the market price of the Nikkei Stock Average (JP225), one of the major stock index CFDs, is 35,000 yen, the required margin for an order with a contract size of 1, trading lots of 5 lots, and leverage of 500x is as follows:
5 × 1 × 35,000 ÷ 500 = 350
XM’s stock index CFD leverage does not change depending on the account type or margin balance, and a fixed leverage is applied to each product. Please note that the open price is constantly fluctuating, so please be careful when calculating margin.
XM Stock Index CFD Spreads
XM’s stock index CFDs are common to all account types and feature variable spreads that offer optimal spreads depending on market conditions . Spreads differ between spot and futures, and different spreads are applied depending on the trading instrument. Spot trading is characterized by spreads that are less susceptible to fluctuations due to market liquidity and trading hours, and tend to have narrower spreads. On the other hand, futures trading involves predicting future prices, so market liquidity is low and spreads tend to be wider. XM’s stock index CFD spreads are as follows:
Lowest spreads on XM Stock Index CFDs (spot)
| Brand | Lowest spreads |
| AUS200Cash (ASX 200) |
1.90 pips |
| CA60Cash (Canada 60 Index Cash) |
0.85 pips |
| ChinaHCash (Hong Kong China H-shares Index Cash) |
3.90 pips |
Spread figures fluctuate, so please check the latest figures when trading.
Lowest spreads on XM Stock Index CFDs (futures)
| Brand | Lowest spreads |
| EU50 (EURO STOXX 50) |
3.00 pips |
| FRA40 (CAC 40) |
3.50 pips |
| GER40 (DAX) |
3.75 pips |
Spread figures fluctuate, so please check the latest figures when trading.
-
XMTrading’s variable spreads tend to widen during early morning hours when market liquidity is low or when market prices fluctuate sharply due to the release of important economic indicators. As spreads widen, trading costs increase accordingly, so please be careful about the timing of your buys and sells.
XM Stock Index CFD Swap Points
XM stock index CFDs are subject to swap points only for spot trading . In spot trading, if you carry your position over business days, you will incur profits and losses due to swap points. Enjoy trading with various trading strategies depending on the stock, such as long-term trades aiming for profits through positive swaps, or short-term trades to avoid losses through negative swaps. Swap points for XM stock index CFDs are as follows.
XM Stock Index CFD (Spot) Swap Points
| Brand | long | short |
| AUS200Cash (ASX 200) |
-1.66 | 0.15 |
| CA60Cash (Canada 60 Index Cash) |
-0.26 | -0.01 |
| ChinaHCash (Hong Kong China H-shares Index Cash) |
-1.58 | 0.07 |
Swap points fluctuate daily, so please check the latest figures when trading.
-
At XMTrading, stock index CFD futures trading is not subject to swap points.
XM Stock Index CFD Min/Max Trade Size
XMTrading’s stock index CFDs have different minimum and maximum trade sizes that can be ordered in a single transaction for each product. Please note that the minimum and maximum trade sizes differ between spot and futures, and also vary depending on the trading platform (MT4/MT5). The minimum and maximum trade sizes for XM stock index CFDs are as follows:
XM Stock Index CFD (Spot) Min/Max Trade Size
| Brand | MT4 | MT5 |
| AUS200Cash (ASX 200) |
0.1/12500 | 0.1/220 |
| CA60Cash (Canada 60 Index Cash) |
– | 0.1/1080 |
| ChinaHCash (Hong Kong China H-shares Index Cash) |
– | 0.1/550 |
| AUS200Cash | |
| MT4 | 0.1/12500 |
| MT5 | 0.1/220 |
| CA60Cash | |
| MT4 | – |
| MT5 | 0.1/1080 |
| ChinaHCash | |
| MT4 | – |
| MT5 | 0.1/550 |
XM Stock Index CFD (Futures) Min/Max Trade Size
| Brand | MT4 | MT5 |
| EU50 (EURO STOXX 50) |
1/12500 | 0.1/280 |
| FRA40 (CAC 40) |
1/12500 | 0.1/280 |
| GER40 (DAX) |
1/12500 | 0.1/230 |
| EU50 | |
| MT4 | 1/12500 |
| MT5 | 0.1/280 |
| FRA40 | |
| MT4 | 1/12500 |
| MT5 | 0.1/280 |
| GER40 | |
| MT4 | 1/12500 |
| MT5 | 0.1/230 |
XMTrading provides a service that allows you to obtain a variety of information related to FX trading, such as the latest market information and market forecasts. There is a wealth of information that can be used as reference by both beginners and experienced traders of stock index CFD trading, so please make use of it when trading.
Check out the most relevant economic indicators
XMTrading’s stock index CFDs are instruments that easily reflect the economic conditions of countries around the world. By checking the schedule, market forecasts, and published results of each country’s economic indicators and understanding the economic trends of that country, you can trade under more favorable conditions. XM provides an “Economic Indicator Calendar ” that allows you to comprehensively check economic indicators from each country. Check the economic indicators related to each stock index CFD and enjoy advantageous trading.
You can collect information necessary for trading through various content
XMTrading offers free content that can be used as a basis for deciding on stock index CFD trading strategies. “FX Signals” delivers chart analysis and market forecasts twice a day for major currency pairs, including the US30 (Dow Jones Industrial Average) and JP225 (Nikkei Stock Average), which are particularly popular among traders in stock index CFDs. “Daily Market Analysis Video” allows traders to easily review the information they are paying attention to through video.
Furthermore, XM offers the ” XMTrading App (XM Smartphone App), ” which allows you to easily access advanced analytical data and the latest market information from TradingCentral, anywhere . The XM App not only allows you to gather information, but also allows you to manage everything from account opening to deposits and withdrawals, and trading using indicators, all in one place. Please take advantage of the various services that are useful for trading stock index CFDs.
-
Currently, the iOS version of the XMTrading app cannot be installed. If you have already installed it, you can continue to use it.
There are many benefits to trading stock index CFDs offered by XMTrading. Take advantage of high leverage and generous bonus campaigns to enjoy stock index CFD trading under more favorable conditions.
Trading with high leverage up to 500x
XM offers industry-leading leverage on stock index CFDs . XM’s stock index CFDs offer leverage ranging from 50x to 500x depending on the stock, with the Nikkei 225 (JP225), a popular index among traders, offering a maximum leverage of 500x. Major US stock indices, such as the S&P 500 (US500), Dow Jones Industrial Average (US30), and Nasdaq Stock Average (US100), can also be traded with a high leverage of up to 500x, allowing for more controlled capital trading. High leverage trading reduces the required margin, making it a recommended option for FX beginners and those looking to start trading stock index CFDs with a small amount of capital.
Zero cut system eliminates margin calls even in shock market conditions
At XM, a zero-cut system is applied to all transactions, including stock index CFDs. The zero-cut system is a system in which, if a loss exceeds the available margin in your trading account due to a sudden market fluctuation and a stop loss cannot be implemented in time, XM will compensate for the negative amount and reset your account balance to zero . At XM, the zero-cut system does not require margin calls (additional margin), so customers will not incur losses that exceed the amount they deposit.
Financial markets can experience shocks, such as historic market crashes like the IT bubble or the Lehman Shock. In such shocks, there is a risk that your FX broker may not be able to implement stop loss measures in time, resulting in large losses that exceed your account balance. At XM, our zero-cut system means that even in the unlikely event of a shock, no margin calls will be required, so you can enjoy trading with peace of mind.
Freely trade both spot and futures
XMTrading offers the advantage of allowing you to freely trade stock index CFD spot and futures depending on your objectives and trading methods. Spot trading is subject to dividend adjustments, and positions can be carried over indefinitely. Furthermore, futures trading does not incur swap points, allowing you to trade with reduced costs when carrying over positions. Each has different characteristics and benefits, so please choose the stock that best suits your priorities and trading style.
Earn extra cash with generous bonus campaigns
XM (XM) offers a wide range of bonus campaigns that allow you to earn additional funds such as bonus credits and cashback. With the ” New Account Opening Bonus ,” you can earn up to 15,000 yen in bonus credits simply by opening a new XM real account and activating it. Additionally, with the ” Deposit Bonus ,” you can earn a bonus worth up to $10,500 by depositing funds into your trading account. These bonuses can be used as margin for trading stock index CFDs, so by making good use of the bonus credits, you can trade dynamically with margin exceeding the amount of your deposit.
In addition, with the ” XM Loyalty Program ,” you can earn XM Points (XMP) that can be exchanged for bonuses or cash every time you trade. Take advantage of the bonus campaigns offered by XM and enjoy trading stock index CFDs in a more advantageous environment.
-
The new account opening bonus is available to all account types, but please note that the deposit bonus and XM loyalty program are not available to KIWAMI Goku Accounts and Zero Accounts.
XMTrading’s stock index CFDs are subject to dividend adjustments only for spot trading. Please understand XM’s dividend adjustment system and enjoy trading under favorable conditions.
What is the dividend adjustment for XM Stock Index CFDs?
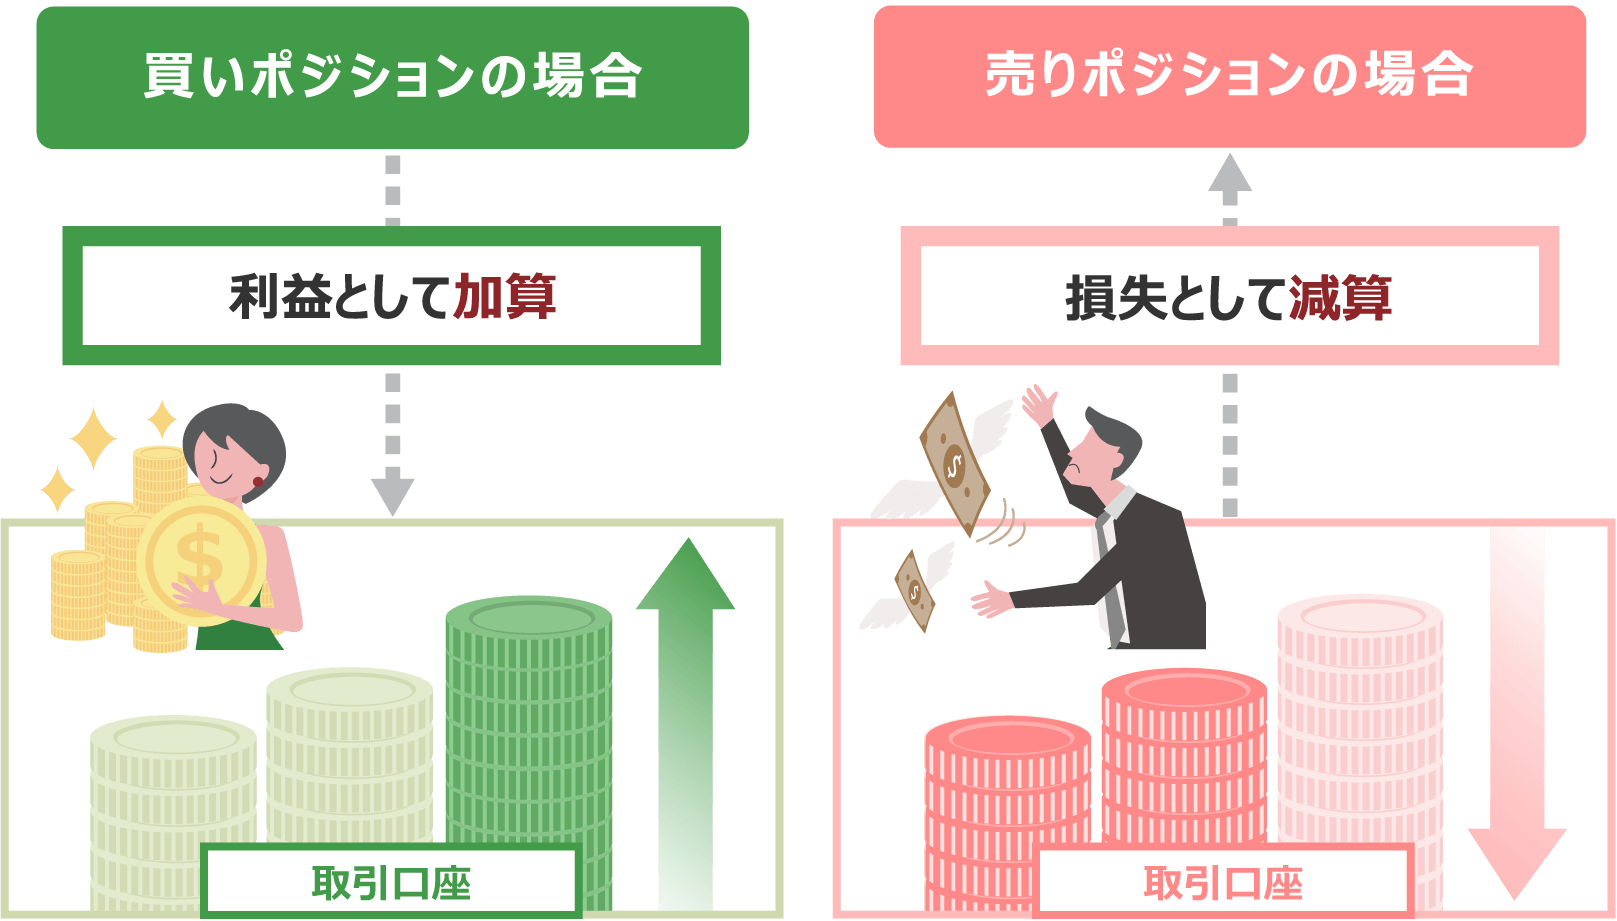
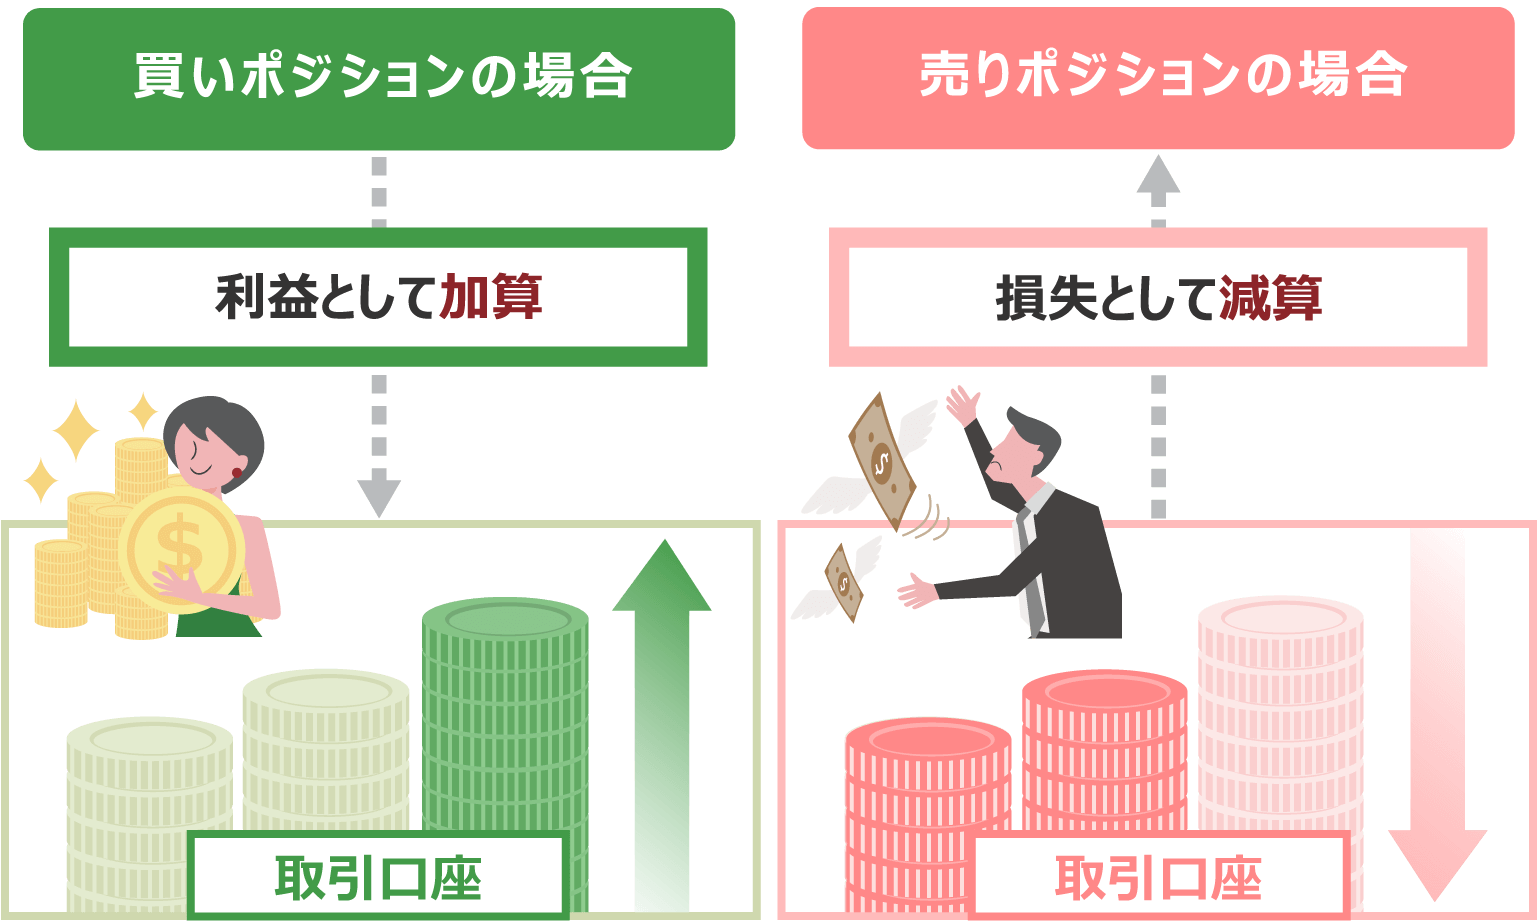
When trading stock index CFDs with XM, the amount equivalent to the dividends distributed to shareholders is reflected in your trading account as a dividend adjustment . Since CFDs generally do not involve ownership of the actual product, you cannot receive dividends directly. Therefore, when dividends are paid on the stocks that make up your stock index CFDs, XM uses a system in which an amount equivalent to the actual dividend is reflected in your trading account as a dividend adjustment. The dividend adjustment is calculated based on your holding position and the rate offered by the company. If you hold a long position, it will be added as a profit, but if you hold a short position, it will be deducted as a loss. Please be careful when managing your positions when receiving the dividend adjustment. Note that with XM stock index CFDs, only spot trading is subject to the dividend adjustment; futures trading is not.
When will dividend adjustments for XM Stock Index CFDs be reflected?
Dividend adjustments for XMTrading stock index CFDs are made in accordance with the timing when shareholders actually receive the dividend . Dividend adjustments are reflected in trading accounts before the market opens on the ex-dividend date so as not to affect positions currently held. The adjustments are reflected at 6:00 AM Japan time during summer time and 7:00 AM Japan time during winter time. Dividend adjustment amounts for long positions are reflected in trading accounts minus withholding tax. Please note that withholding tax deductions do not apply to short positions.
How to calculate dividend adjustments for XM Index CFDs
XMTrading’s stock index CFD dividend adjustment is added or subtracted from your trading account based on the presented index dividend and trading volume (trading position). An example of the calculation of XM’s stock index CFD dividend adjustment is shown below.
How to calculate dividend adjustments for XM Index CFDs
Declared index dividend x Stock index CFD spot position size (number of lots)
= Dividend adjustment amount
For example, if the index dividend for the S&P 500 (US 500) is 0.135 and you hold 10 lots in a long position, the amount calculated using the following formula minus the amount of withholding tax will be added to your trading account as profit.
0.135 x 10 lots = $1.35
The amount of $1.35 minus withholding tax will be credited to your trading account as profit.
If you held a short position in the S&P 500 (US 500) spot under the same conditions, the amount calculated using the following formula would be deducted from your trading account as a loss.
0.135 x 10 lots = $1.35
$1.35 will be deducted from your trading account as a loss
-
For GER40Cash (DAX), GerMid50Cash (MDAX), and GerTech30Cash (TecDAX), dividends are reinvested in the stock index itself, so they are not subject to dividend adjustments even in spot trading. Therefore, you will not receive any profits or pay any losses.
Please note the following points when trading stock index CFDs with XMTrading.
Pay close attention to stock index trends
When trading stock index CFDs with XM, it is important to pay close attention to stock index trends. Stock indexes represent specific stock markets or economic indicators for each country, and are calculated based on the average stock price and market capitalization of the constituent stocks. Therefore, market price fluctuations due to corporate performance or sudden news events are linked to the price of the stock index, which can result in unexpected losses. When trading XM stock index CFDs, it is important to fully understand the characteristics and composition of each stock index, keep a close eye on market information, and enjoy trading with reduced risk.
For details on the major stock indexes handled by XM, click here
The symbol names for stock index spot and futures are different
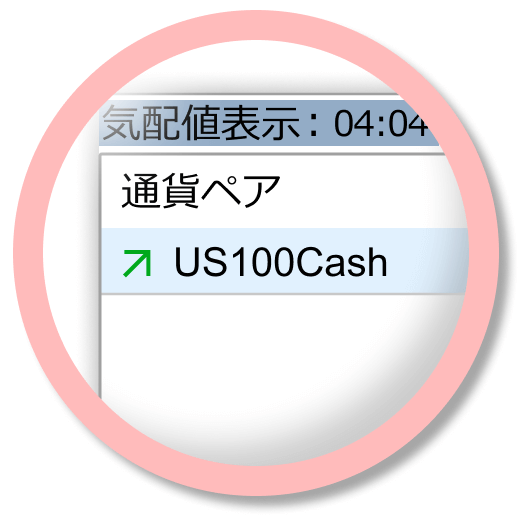
XMTrading’s stock index CFDs have different symbol names (product names) in MT4/MT5 for spot and futures products. Spot products have “Cash” at the end of the symbol name, while futures products are distinguished by the expiration month (month and year) at the end of the symbol name, such as “-MAR25”. The trading periods for futures contracts and spot contracts are different, so please be careful when selecting a product when trading.
-
Actual item
-
futures
-
現物
-
先物
Hedging between multiple accounts is prohibited
XMTrading prohibits hedging across multiple accounts. Hedging is permitted only within the same account, but hedging across multiple XM accounts and hedging across different brokers is not permitted. If you engage in hedging across multiple accounts, you may be subject to severe penalties such as account freezing and profit cancellation. If you are using multiple accounts to trade stock index CFDs, please be careful not to unintentionally engage in hedging.
Be aware of changes in trading hours due to market closures
When trading stock index CFDs with XMTrading, please be aware of changes in trading hours due to market closures, etc. Stock index CFD trading hours may change during the New Year’s and Christmas periods, as well as national holidays in various countries, as stock exchanges in each country are closed. Changes in trading hours will be announced in advance in the ” XM Latest News (Notices from the Site) “. Also, please check the details in the information email sent to the email address registered with XM.
-
What are the trading hours for XM stock index CFDs?
XM’s stock index CFD trading hours vary depending on the stock exchange. There may also be differences depending on the stock and summer/winter time, so please check the trading hours of the stock you are using in advance when trading. Changes in trading hours due to market closures, etc. will be announced in advance in the “XM Latest News (Announcements from the Site)”.
read more
2024.12.18
-
Are there any leverage limits on XM Index CFDs?
No, there is no limit on leverage with XM stock index CFDs. Leverage does not fluctuate depending on the balance (account funds) of your trading account, and you can trade at a fixed margin rate for each product. The maximum leverage (50x to 500x) varies by product, so please check the leverage of each product when trading.
read more
2024.12.18
-
Are there swap points on XM stock index CFDs?
Yes, with XM’s stock index CFDs, swap points are only charged for spot trading. You can trade according to your own strategy, such as long-term trades aiming for profits through positive swaps or short-term trades to avoid losses through negative swaps. Please note that swap points are not charged for futures trading.
read more
2024.12.18
-
Can I receive dividends on XM Index CFDs?
Yes, you can receive dividends (dividend adjustments) with XM’s stock index CFDs. Since XM’s stock index CFDs do not directly hold physical products, you cannot receive dividends paid by companies to shareholders as they are. Instead, the amount equivalent to the dividend is reflected in your trading account as a dividend adjustment.
read more
2024.12.18
-
Does XM allow trading index CFDs on all account types?
Yes, all account types at XM allow you to trade stock index CFDs. The same trading conditions are available for all four account types: Standard Account, Micro Account, KIWAMI Account, and Zero Account. Choose the account type that best suits your trading strategy and enjoy trading stock index CFDs with XM.
read more
2024.12.18